progress update

I've been a busy bee for most of the last few weeks. Here's what happened, roughly:
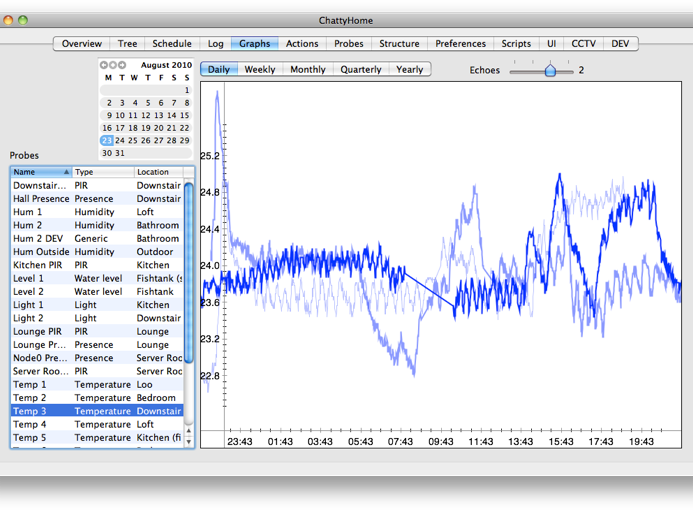
I have completely rewritten the graphs (told you I was not that excited with JpGraph ;). They are based on CorePlot now and are part of the Client and Server, I don't need php nor even apache anymore. The same code is used to generate .png file of the graph or to display it in <NSView> in the client, and the wrapping engine I have written on top of CorePlot is flexible enough to accept as parameters the run date, number of days, number of echoes and array of probes shown. Echoes are basically plots for the same data but shown for a previous period, i.e. when number of days is 1 and number of echoes is 1, its going to draw me one day in bold colour and the previous day in thinner line and weaker shade of the same colour. There's no limit to the number of echoes other than it starts looking unreadable if you have more than 3.
Major internal changes in the Server
I have rewritten the whole pipeline of what is happening when input of any kind (i.e. scheduled actions or interface input) is detected through to executing the action, and how scripts can interact with it. It is more streamlined and robust than before, previously I had difficulties to remember and understand how it all works ;] The delay between pressing a button in the client and seeing the action executed is also reduced significantly, to a point that you can probably call it real-time now.
I have rewritten the whole temperature control bit, moved it from being hard-coded in Objective-C to be a user editable SQL script.
I have rewritten the hardware interface infrastructure to be hardware agnostic, at the moment I only have one module for Arduino, but at some point I'll de-dust the old code for Velleman so ChattyHome can be used with either or both, and I'll be adding new modules based on popular requests.
I have added embedded http server in the Server, based on <this> with added <Bonjour> advertising. At the moment it hosts fully configurable graphs, i.e. you can point a browser to http://127.0.0.1:1888/graph.png?3,17,8&yesterday&1&2 and it will show you 1 day long graph for yesterday ('yesterday' can be a proper date too, I'm using [NSDate dateWithNaturalLanguageString:]) with 2 echo intervals for probes 3, 17 and 8. If you point your browser at http://127.0.0.1:1888/tree.xml you will get an array of dictionaries containing the structure and state of the system, i.e. all its locations, paths, actions with current value and mode and probes with current value. I plan to rewrite all the clients, i.e. Mac, Web, iPhone, iPad and Dashboard Widget to use this.
I made the Server a stand-alone command line application, it doesn't need the Client to run at all. All the communications between Client and Server are happening through SQL interface tables.
I have added a very crude software filtering of samples, it will check if the current sample taken is considerably different than the last few minutes' average and try to re-sample it up to three times. It helped a bit but I need to work on the hardware side of things to get rid of the noise proper.
I have changed Locations to be a hierarchical tree structure.
I was playing with lots of bits and bobs, i.e. added FeedbackReporter.framework, added mock-up CCTV display within the Client, started work on natural language commands using todparsekit.framework.
Changes in the Client for Mac
I have split the Action / Probe tab and extracted commands for Actions into a separate NSTableView (it used to be a column).
I have added Structure tab to host Paths and the new NSOutlineView for Locations.
I have added a Tree tab, it displays a structural view of the objects in the house: all Locations, Paths, Actions and Probes. When you select a probe it will show you the current value and also a quick graph of the last 24h, if you select an Action it will show you the current mode and value of the action, the interface is dynamic based on the descriptions in ActionCommands.
Overview tab is currently partially broken as part of the Server pipeline rewrite changed the way mode for Actions works. Actions can be manipulated from the Tree tab and I'm working on a more flexible approach to the Overview tab, it is all ugly hard-coded now.
I'll try to update screenshots and Technology page in a few days.
From all the above changes two are most important to making ChattyHome capable of running any and not only my own home: the Tree tab can manipulate and execute any Action and can display any Probe, thus rendering the hard-coded Overview superfluous. I still want to have a flexible Overview as it looks nice and all, but now the system can run any house just through the Tree, even if it's somewhat crude at the moment. The second is the new graphing system - it means that installing and configuring jpGraph is no longer necessary, and neither is running Apache with php. This is important because installing and configuring jpGraph is by no means easy - it took many hours of work first time I did it and when trying to do it the second time after moving the server from one machine to another, running Snow Leopard, I failed and gave up.
The Server, even if a stand-alone CLI app, is in fact still shipped as part of the Client's application bundle, so the installation of both is still done in a normal Mac way, just drag it and drop it in the Application folder or wherever you wish. All that is needed to run ChattyHome in addition to itself is PostgreSQL server, and installing that is <very easy>. I don't have any documentation yet on how to configure it, but I would love if you wanted to give it a try and I'll give you all the support you'll need.
Monday, 23 August 2010