how to graph in JpGraph

Pretty easy really as there is very good documentation and tutorials available, so you don't have to figure things out, just follow the procedure. The one thing which they maybe don't give you is detailed how-to on connecting your datasource, but then again there's is plenty of examples available on the web, just google how to do it in php, depending of course on what is your datasource and how it is organised. ChattyHome at the moment is using one big table in an SQL database to store data, and all the samples from all the probes go there:
Monday, 5 July 2010
I remember that doing the graphs took me one weekend, but it was preceded by quite a lot of research on the web. I think it is very important to pick the right tools for your project from the start so you don't have to drop them in the future, as it is always a waste of time to certain extent, even if you learn something new. I mean, you could have learned something more usefull in that time ;) A good example of wasted time was my initial decision to go with MySQL, as per my previous entry, another would probably be if I went with one of the flash-based graphing libraries, like this one. Sure, they look nice, they can have a lot of cool flashy features - but they don't work on iPhone nor iPad, and they never will. They don't even work in the embedded Cocoa WebView, although I suspect there could be workarounds for that. In any case that means I would have to have two solutions for graphs, one flash-based for the web and maybe Mac app, and something else for iOS devices, which would be a waste of time, wouldn't it ;).
Another interesting graphing solution I know of that some fellow DIYers are using is this one, but I'm a bit of a control freak when it comes to my projects and most of the time I try to use solutions I have full control over.
Having said all that, I'm not entirely happy with JpGraph and I don't want to invest much more time in it at the moment, so the graphs are pretty much untouched since I concocted them initially and certain things are not really finished. But they give me a very good idea of what's happening within the system, and that is good enough for now.
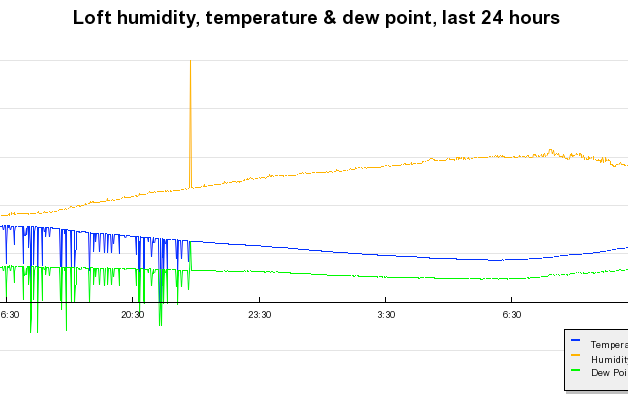
The most complicated graph I have at the moment is the one showing temperature, humidity and dew point in the loft, so I'm gonna give you that rather than some useless select * from Sample ;)
<?php
require_once('jpgraph/jpgraph.php');
require_once('jpgraph/jpgraph_line.php');
include('dblogin.php'); // basic mysql connection stuff
$RESULT = mysql_query(
'select s1.value as temperature, s2.value as humidity, hour(s1.date) as time,
(237.7 * (((17.271 * s1.value) / (237.7 + s1.value)) + ln(s2.value/100))) / (17.271 - (((17.271 * s1.value) / (237.7 + s1.value)) + ln(s2.value/100))) as dewpoint
from Sample s1, Sample s2
where s1.probe = 1 and s2.probe = 19
and s1.date >= date_sub(now(),interval 1 day) and s2.date >= date_sub(now(),interval 1 day)
and year(s1.date) = year(s2.date) and month(s1.date) = month(s2.date) and day(s1.date) = day(s2.date)
and hour(s1.date) = hour(s2.date) and minute(s1.date) = minute(s2.date)
order by s1.date');
if ( $myrow = mysql_fetch_array($RESULT) ) {
do {
$data[] = $myrow['temperature'];
$data2[] = $myrow['humidity'];
$data3[] = $myrow['dewpoint'];
$label[] = $myrow['time'].':30';
//$label[] = $myrow['date'];
} while ( $myrow = mysql_fetch_array($RESULT));
}
// Create a graph instance
$graph = new Graph( 950, 420);
$graph->SetFrame(false);
$graph->SetScale('intlin', 0, 0, 0, count($data)-1);
$graph->SetTickDensity( TICKD_SPARSE );
$graph->img->SetAntiAliasing();
$graph->title->Set('Loft humidity, temperature & dew point, last 24 hours');
$graph->title->SetFont(FF_ARIAL, FS_BOLD, 14);
$graph->xaxis->SetTickLabels($label);
$graph->xaxis->SetFont(FF_ARIAL, FS_NORMAL, 7);
$graph->yaxis->SetFont(FF_ARIAL, FS_NORMAL, 7);
// Create the linear plot
$lineplot=new LinePlot($data);
$lineplot->SetColor('blue@0.25');
// Create the linear plot
$lineplot2=new LinePlot($data2);
$lineplot2->SetColor('orange@0.25');
// Create the linear plot
$lineplot3=new LinePlot($data3);
$lineplot3->SetColor('green@0.25');
// Set the legends for the plots
$lineplot->SetLegend('Temperature');
$lineplot2->SetLegend('Humidity');
$lineplot3->SetLegend('Dew Point');
$graph->legend->SetPos(0.135,0.93,'right','bottom');
$graph->legend->SetFont(FF_ARIAL, FS_NORMAL, 7);
// Add the plot to the graph
$graph->Add($lineplot);
$graph->Add($lineplot2);
$graph->Add($lineplot3);
// Display the graph
$graph->Stroke();
?>
<?php
require_once('jpgraph/jpgraph.php');
require_once('jpgraph/jpgraph_line.php');
include('dblogin.php');
$RESULT = mysql_query(
'select probe, makedate(year(date), dayofyear(date)) as date, hour(date) as time, avg(value) as value
from Sample
where probe = 1 and date >= date_sub(now(),interval 7 day)
group by probe, makedate(year(date), dayofyear(date)), maketime(hour(date),0,0)
order by date');
if ( $myrow = mysql_fetch_array($RESULT) ) {
do {
$data[] = $myrow['value'];
$label[] = $myrow['time'].':30';
//$label[] = $myrow['date'];
} while ( $myrow = mysql_fetch_array($RESULT));
}
$RESULT = mysql_query(
'select probe, makedate(year(date), dayofyear(date)) as date, maketime(hour(date),0,0) as time, avg(value) as value
from Sample
where probe = 19 and date >= date_sub(now(),interval 7 day)
group by probe, makedate(year(date), dayofyear(date)), maketime(hour(date),0,0)
order by date');
if ( $myrow = mysql_fetch_array($RESULT) ) {
do {
$data2[] = $myrow['value'];
} while ( $myrow = mysql_fetch_array($RESULT));
}
// Create a graph instance
$graph = new Graph( 950, 420);
$graph->SetFrame(false);
$graph->SetScale('intlin', 0, 0, 0, count($data)-1);
$graph->SetTickDensity( TICKD_SPARSE );
$graph->img->SetAntiAliasing();
$graph->title->Set('Loft humidity & temperature, last 7 days hourly average');
$graph->title->SetFont(FF_ARIAL, FS_BOLD, 14);
$graph->xaxis->SetTickLabels($label);
$graph->xaxis->SetFont(FF_ARIAL, FS_NORMAL, 7);
$graph->yaxis->SetFont(FF_ARIAL, FS_NORMAL, 7);
// Create the linear plot
$lineplot=new LinePlot($data);
$lineplot->SetColor('blue@0.25');
//$lineplot->SetFillColor('orange@0.75');
// Create the linear plot
$lineplot2=new LinePlot($data2);
$lineplot2->SetColor('orange@0.25');
//$lineplot2->SetFillColor('blue@0.75');
// Set the legends for the plots
$lineplot->SetLegend('Temperature');
$lineplot2->SetLegend('Humidity');
$graph->legend->SetPos(0.01,0.93,'right','bottom');
$graph->legend->SetFont(FF_ARIAL, FS_NORMAL, 7);
// Add the plot to the graph
$graph->Add($lineplot);
$graph->Add($lineplot2);
// Display the graph
$graph->Stroke();
?>
Here are the live graphs.
At the time of writing you could clearly see a lot of noise on the daily graph and it is easy to see that this noise overlaps with the hours when the main light over the fishtank is on... One of the benefits of a system which can produce graphs, the main one being able to impress your friends of course ;)
As you can see the dev point is calculated on the fly which is kinda cool and kinda slow at the same time ;)
And this is the weekly version: